
 Facebook
 Twitter
 Pinterest
 Copy Link
There are a lot of worries and speculation being voiced about home values in our area being at bubble levels and worries about when and what will cause the bubble to burst. The graph below may help allay some of those fears as it shows the monthly payments for homes over the past 27 years and how those relate to affordability and home value appreciation.
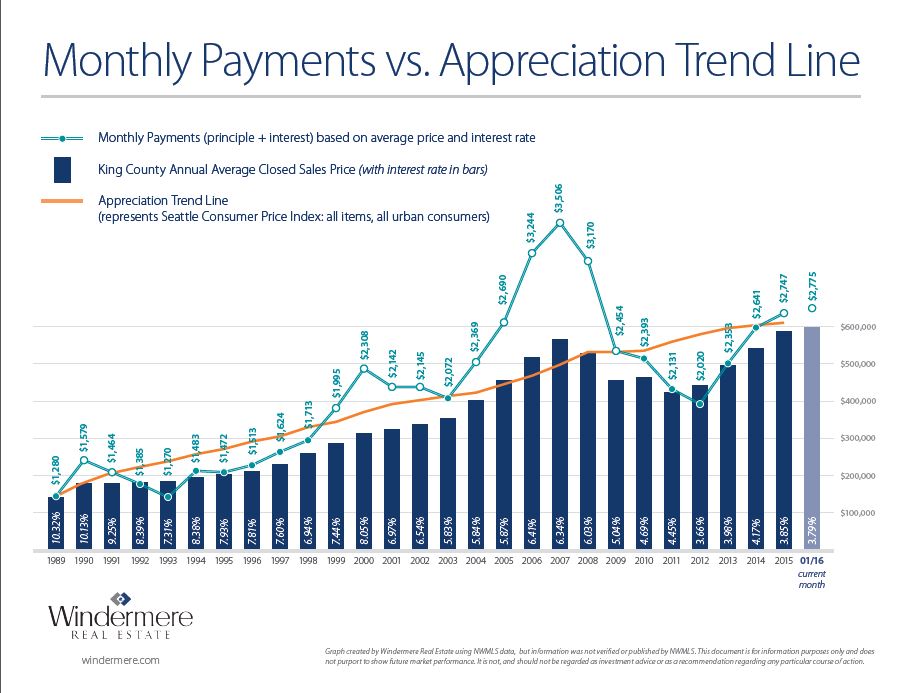
The graph shows the average house payment in our area and home sales activity over this period. What it illustrates is that while our home values have risen, as have overall sales, the decline interest rates has helped to keep our increasing home values and payments affordable. The payment peaks correspond to market value peaks and similarly to declines, whether from the 1990 decline, the Dot.com decline in 2000 or the run up and subsequent fallout from the "Great Recession" of '07-'09. This also shows that our home sales are back at full recovery in quantity and for many homeowners, at or above prior peak values. Yet our payments are well below peak values. This bodes well for continued strength in housing values.
Historically we see that our payments tend to run just below the appreciation trend line with the few rises preceding our market struggles. We had a much larger peak in the '07 run up, and certainly a much bigger fall. At the far left of the graph you can see that we've just begun to peak above the trend line again; so what does this mean? In the past we've seen 1-3 year durations to these peaks in payment values. However, we are currently in a stable to declining interest rate market and a bit more of a struggle for world economies. Might this affordability prolong our ability to remain above the trend line?
For the core Seattle and Eastside communities the answer is likely yes. Many of the large local employers are continuing to have strong employment and certainly we have more workers coming into our market from other regions of the country and the world. With a more broad-based wage increase and stable to low interest rates, it's likely we have another 2 years of value rises but as many of us might remember from our high school math classes, the theory of Regression to the Mean, will likely catch back up to us and we'll see a combination of rising interest rates and declining values at some point in our relatively near future.
While it's difficult to predict when, it is usually better to be selling into these peaks rather than at or just past them. That said, if there is no reason for you to be moving in the near future, then relax and don't worry about this. However, if you are wanting to sell in the not too distant future, then you may want to make plans to do so sooner, so you can capture the peak value of your home. If you're buying or would buy after you sell, it's still good to know our near record low interest rates are in your favor and will help you make that next home purchase the most affordable we'll likely see in any near term timeframe. Since you will likely be staying put in that new home for 5-7 years, then any intermediate downturn isn't really affecting you. You weren't planning to sell and move, so ride it out, like most of us did during the last downturn and we'll see rebounding values on the other side, just further down the road.
So does this mean we're going into or are at a bubble in the market? Not in any traditional sense as our home values are based more on job, wage and population growth; our local economy is one of the strongest in the country and the very low interest rates are keeping home affordability more in check than in previous run-up periods. Can values drop? Most assuredly. Are we likely to see something like 2007-2009? Not very likely, barring catastrophic world events. Our home mortgages and home equity positions have all strengthened and this will dramatically reduce any bump in defaults, foreclosures and dramatic drops in home values. So relax, capture your gains or step up to that next home with more confidence in your future.
